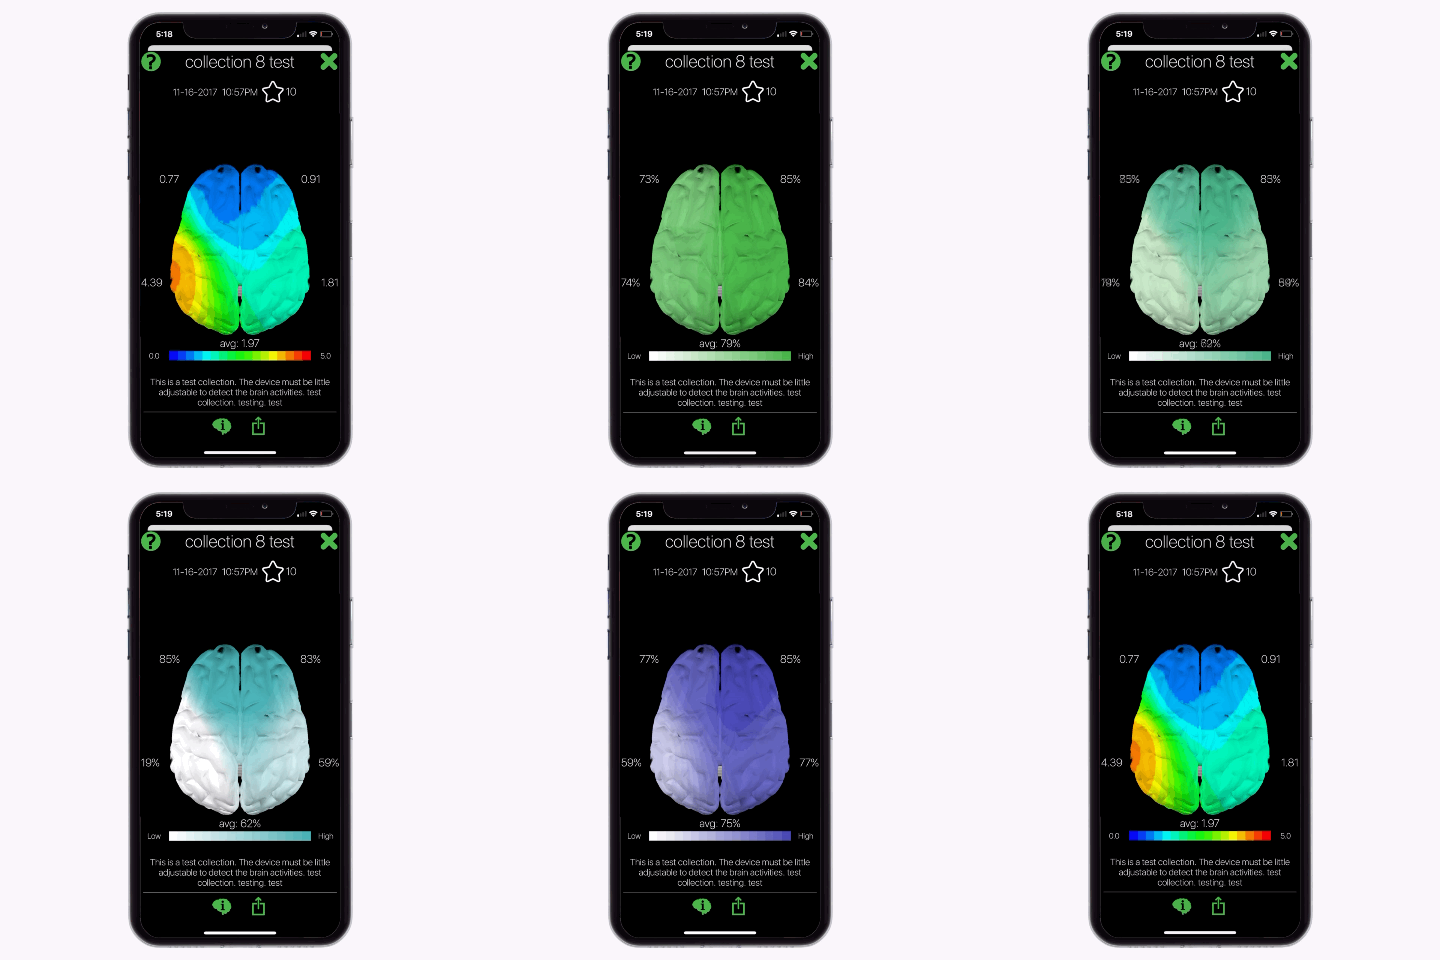
Opti Brain offers a wide range of mapping options. This can be intimidating if you are unfamiliar how to read and interpret maps.
If you select the brain information icon at the bottom of each map, a short interpretation of the map appears. This interpretation, however, is just the beginning of reading and understanding brain maps!
We’d like to give you a head start on understanding what brain maps say and how to use them! Select an option below that interest you.
Tutorials for Reading and Using Brain Maps
Opti Train, Calm and Confidence Maps
Opti Train The Opti Train brain pattern is produced when all your Levels of Thought are producing the same pattern of colors on a brain map, or in other words when all your Levels of Thought are...
Brain Map Movies
The newest Opti Brain mapping feature is second by second movies. Setup a movie in Opti Brain by selecting the brain with a play/pause icon inside. When the brain map is played, it updates every...
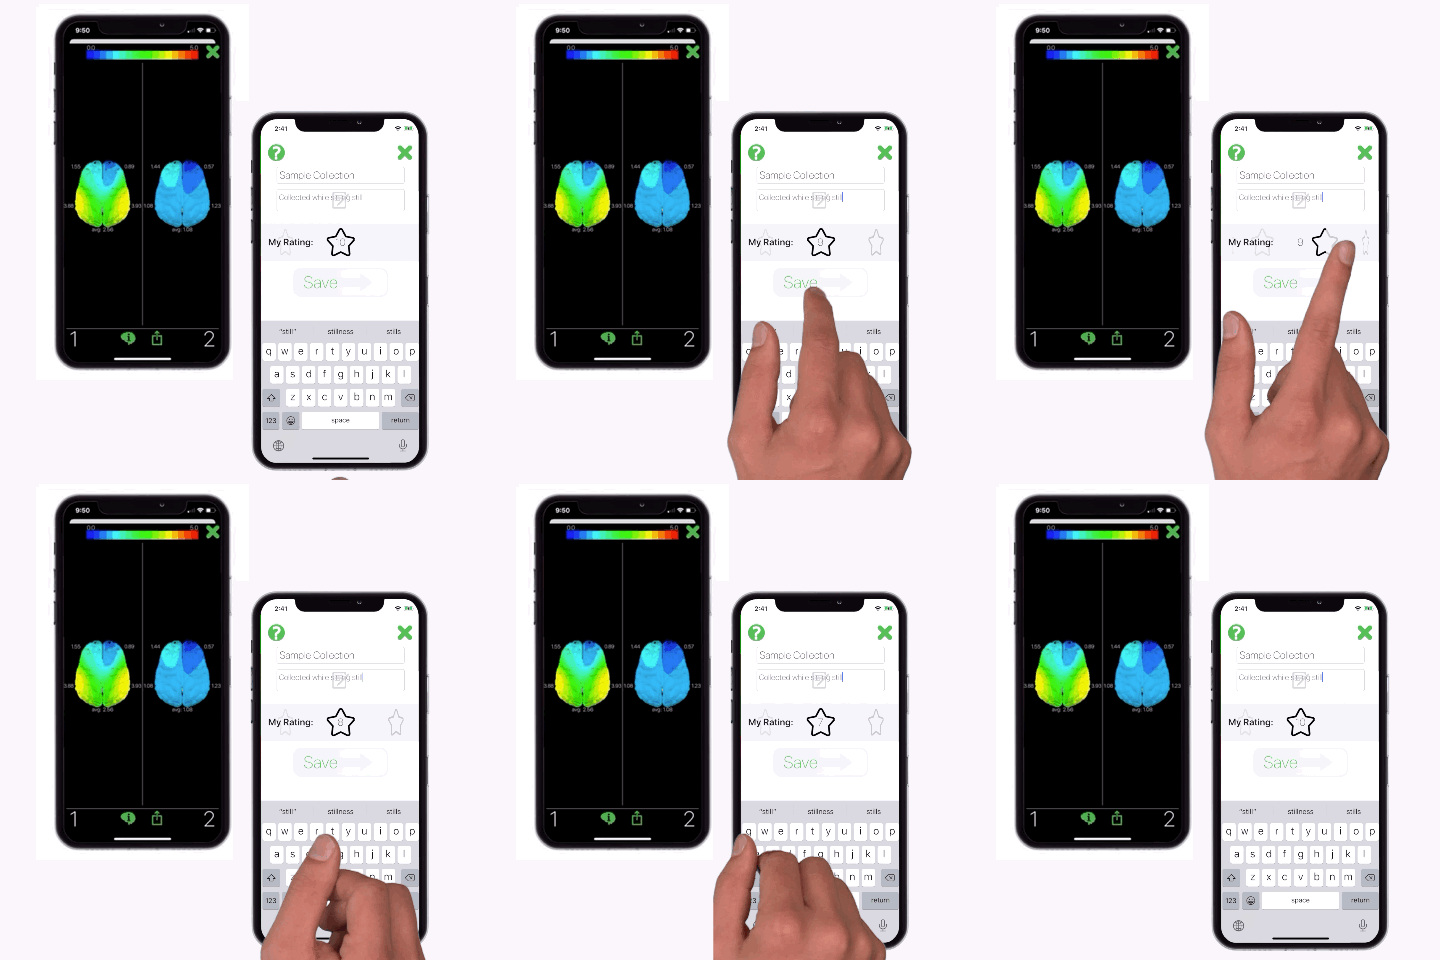
Comparing Maps and Quality Rating
A powerful tool Opti Brain offers is to analyze the brain maps from two sets of data collections at the same time. Select the icon featuring two brains to turn on compare collections. Then tap...
Still vs In Motion Mapping
Most brain activity research and software focuses on collecting brain data while sitting still and either meditating or performing logic puzzles. However, Opti Brain differs from this because we...
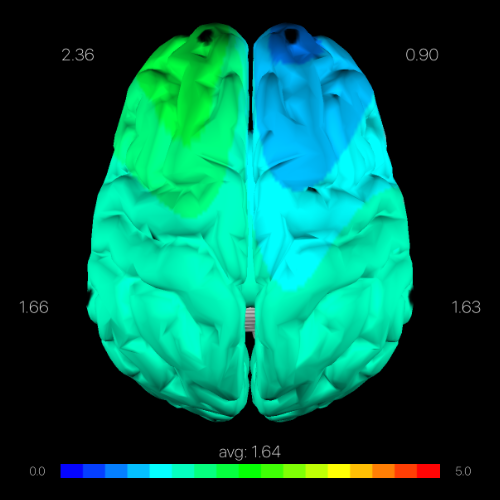
Total Brain Activity
Your total brain activity is the total amount of electrical activity produced by your brain. Warm colors correspond to high brain activity and cold colors represents low brain activity. If the...
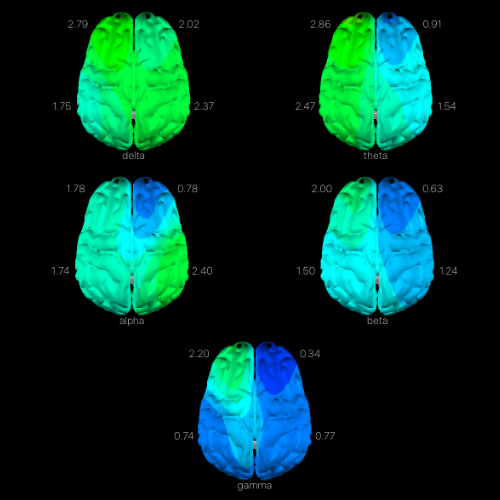
Levels of Thought (Power Bands)
When mapping your brain, instead of dividing the brain activity up by geographical areas, it is common to divide it up into power bands or Levels of Thought. The icons with four or five...


